
The resourcing content pack provides the details of the resource hours on the assigned project. The key elements of this report are:
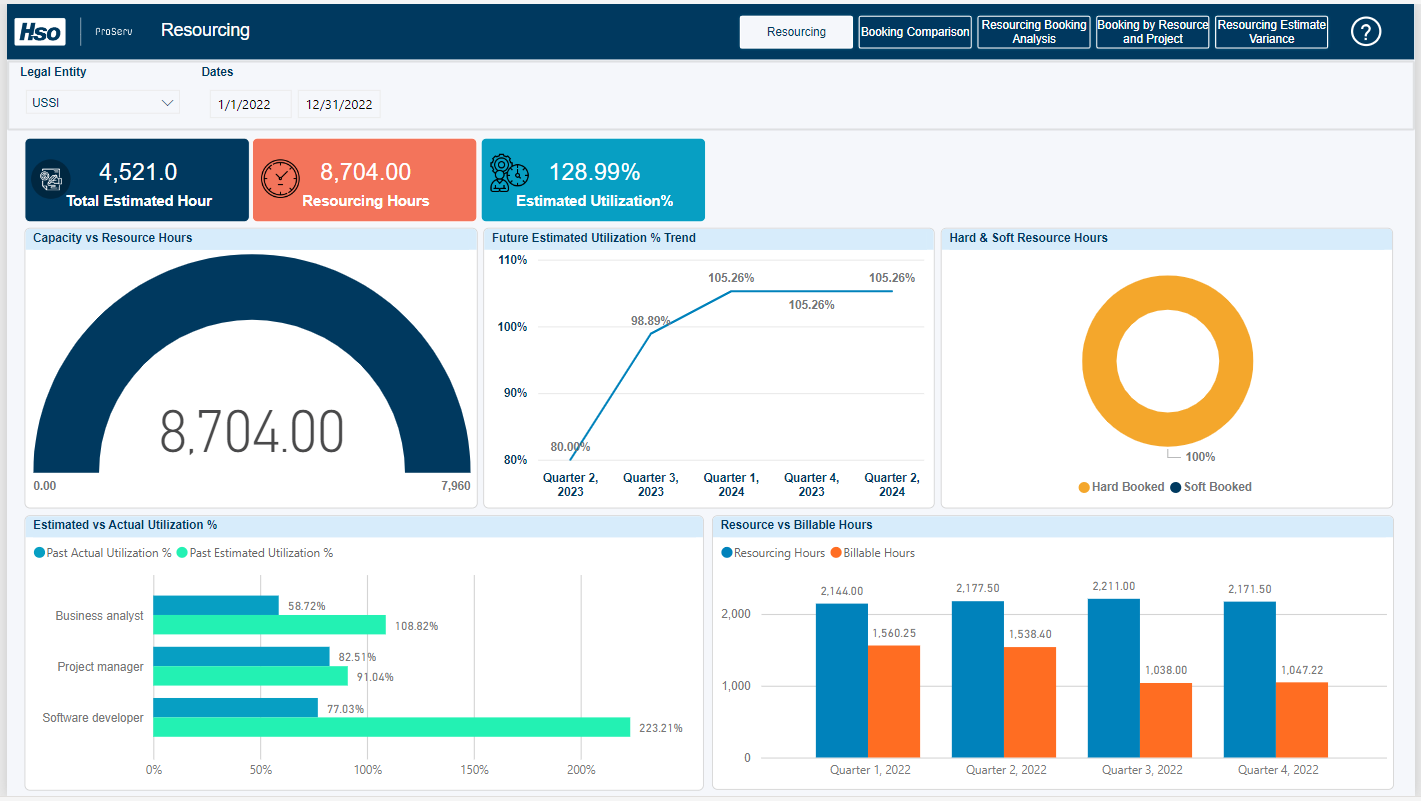
Resourcing: It gives an insight when comparing pairs of the following factors:
* Resource Capacity vs. Actual Booked Hours by Resource .
* Hard Booked vs. Soft Booked .
* Estimated Utilization% vs. Actual Utilization% .
* Actual Booked Hours by Resource vs. Billable Hours Booked by Resource .
Along with these comparisons, this report provides an insight into the future estimation of the overall utilization rate of the entire organization. These visuals are helpful to identify if they are being effectively utilized or not.
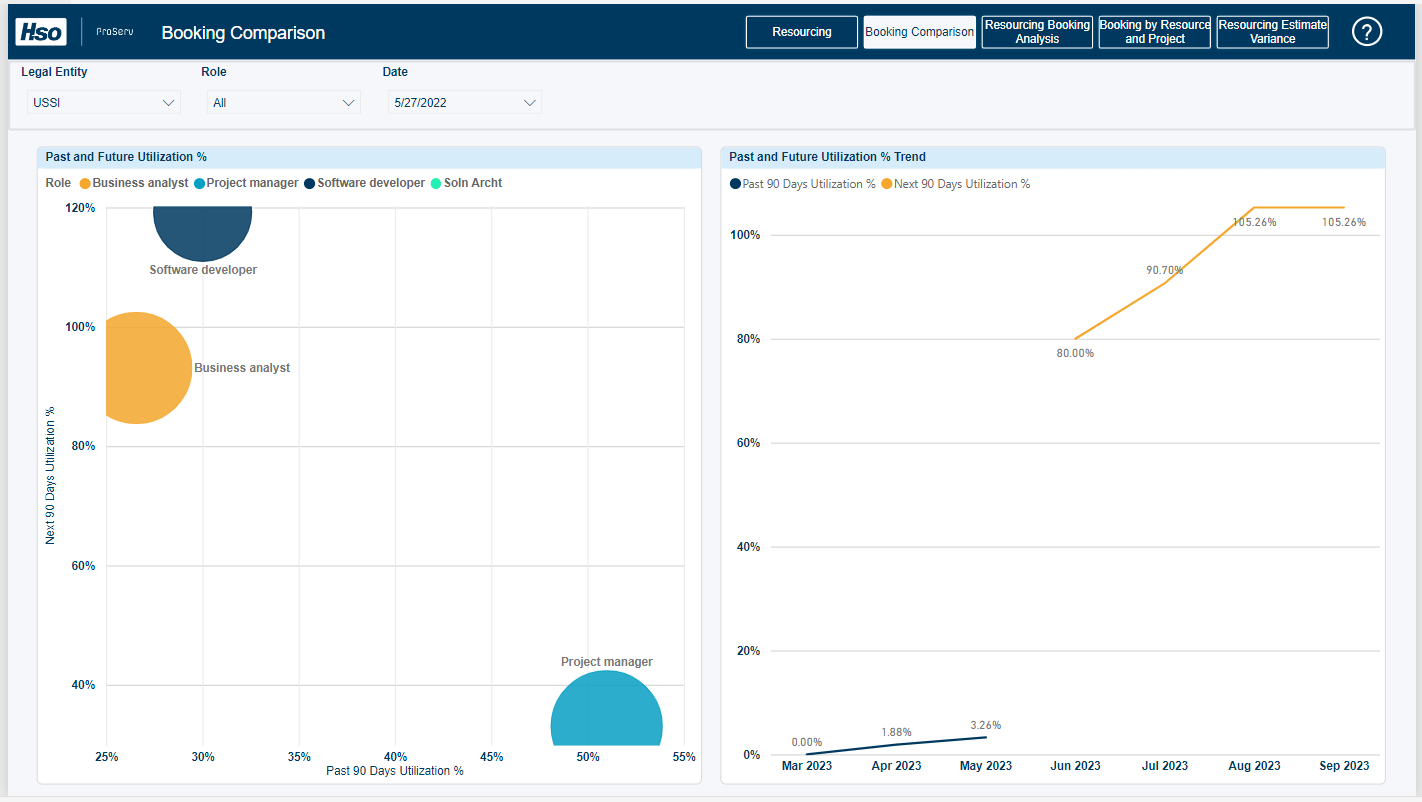
Booking Comparison: It gives an idea about the ‘Past Utilization %’ and ‘Future Utilization % based on resource role, which will be helpful in the project budget.
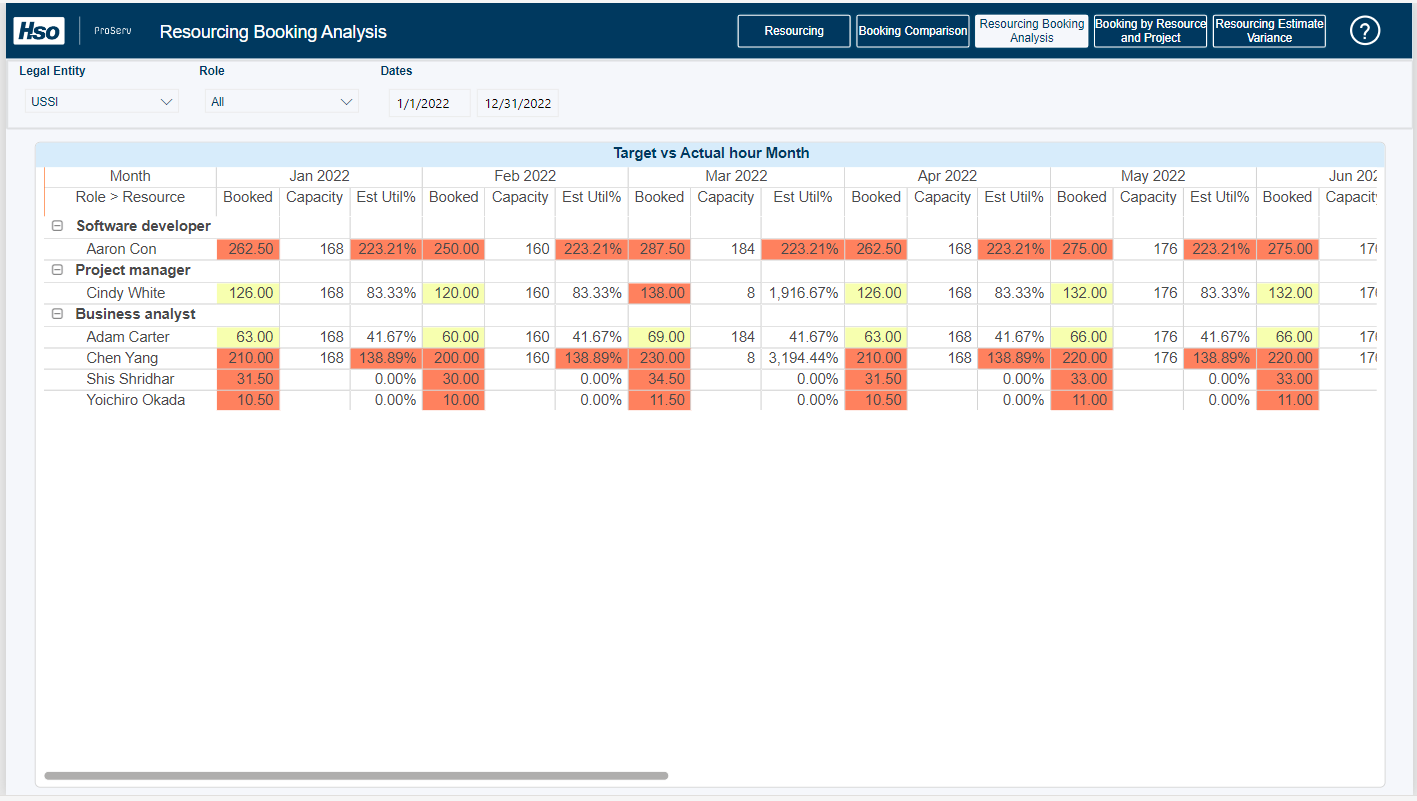
Resourcing Booking Analysis: It shows the comparison between the actual hours and capacity hours and shows an estimated utilization percentage based on the resource role. It helps in optimizing the resource forecasting process and improving resource utilization, resulting in reduced project costs.
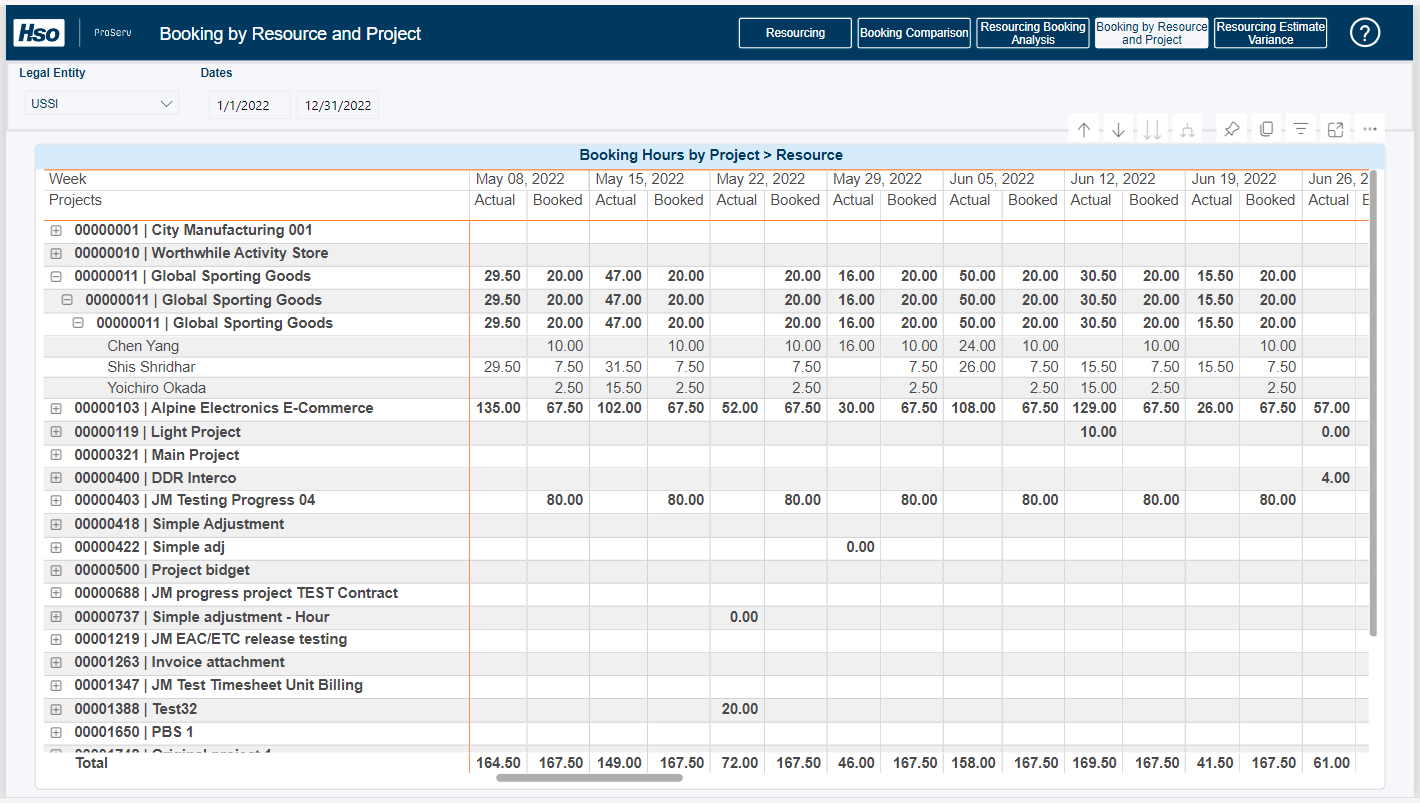
Booking By Resource and Project: It shows the comparison between actual hours and resourcing hours of all resources for every week.
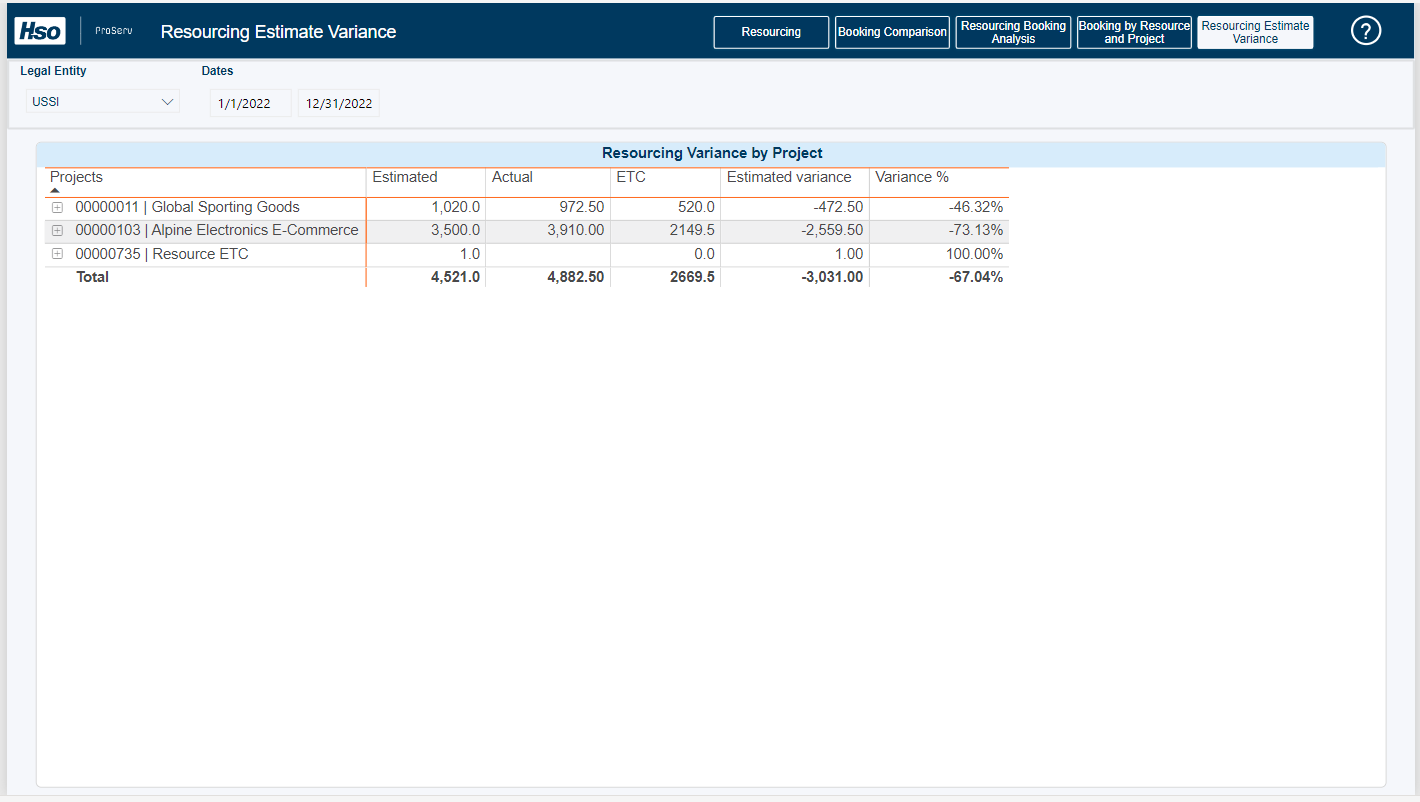
Resourcing Estimate Variance: It provides an analysis of the deviation between resource forecast and actual values and how well forecast values are aligned with real outcomes.
This report gives an overall idea about resource utilization (Over or Under), effort spent on any project, future utilization estimations, identifying areas for improvement, and assessing efficiency.
In the first tab, Resourcing, on the first row, it shows the overall capacity of the organization vs. how many hours are booked, the percentage comparison between hard booking and soft booking, and the estimated utilization percentage for the future. In the second row, it shows the comparison between past actual utilization percentage and past estimated utilization percentage and the comparison between resourcing hours and billable hours’.
On the second tab, Booking Comparison, on the left side, it shows the utilization percentage of the past 90 days and the upcoming 90 days based on the role. On the right side, we are displaying the utilization percentage of the previous and upcoming 90 days on a monthly basis.
On the third tab, Resourcing Booking Analysis, it shows the booked hour, available capacity, estimated utilization percent on a monthly basis for each role, and associated resources.
On the fourth tab, ‘Booking by Resource and Project’, it shows the ‘Actual Hours’ and ‘Booked Hours’ on a weekly basis for each project and associated resources.
On the fifth tab, ‘Resourcing Estimate Variance’, it shows the estimated hours, actual booked hours, estimated time to complete, estimated variance, and variance percentage for each project and associated resources.
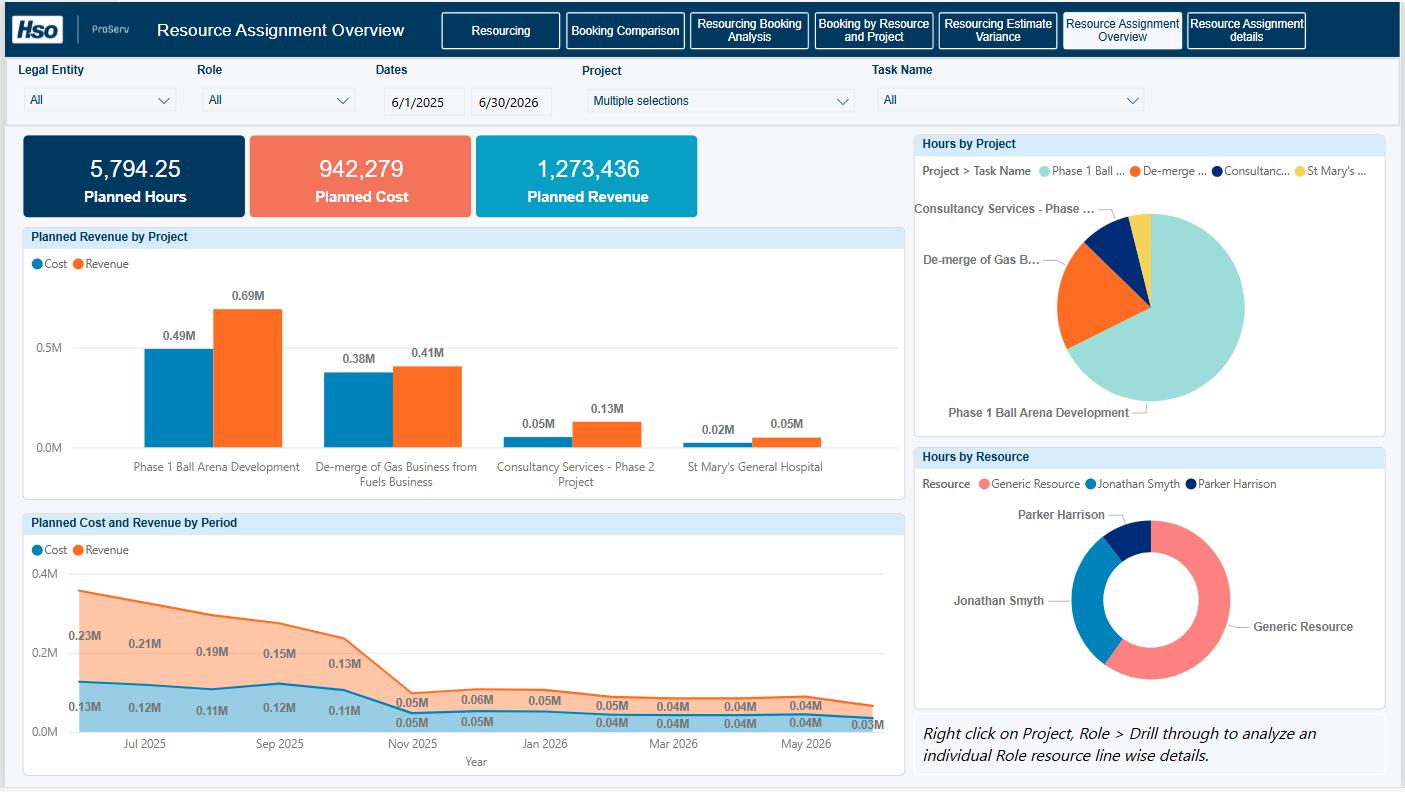
On the sixth tab, ‘Resource Assignment Overview’, it shows the Planned hours, Planned Cost Planned Revenue for each project and associated Role.
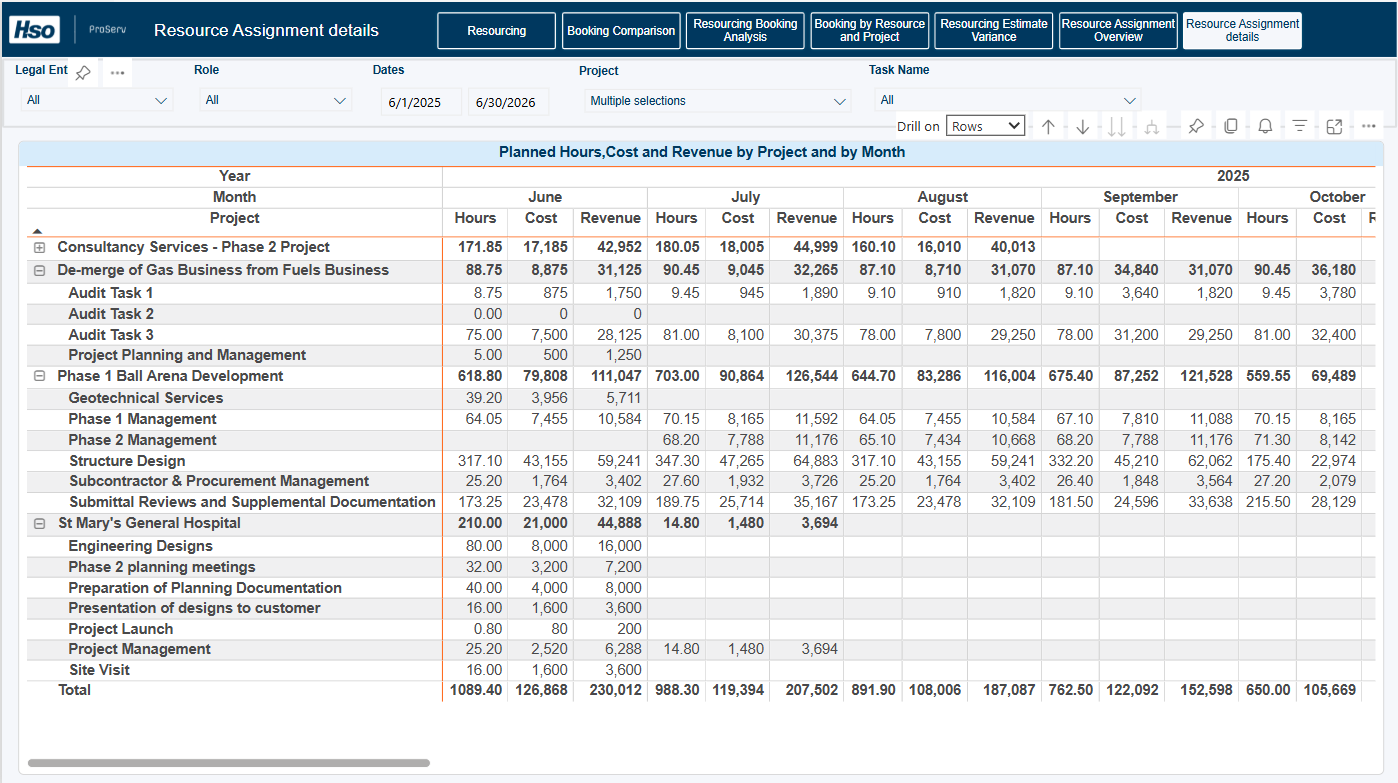
On the seventh tab, ‘Resource Assignment Details’, it shows the planned hours, Planned Cost Planned Revenue for selected project and Task by selected period.
Post your comment on this topic.