
This report provides an overview of resource utilization within the organization.
This report is targeted at project managers and helps them understand the trends in billable hours and employee utilization.
This gives the historical trend by hierarchal level: quarters, months, and weeks.
This report helps to identify and quantify the extent to which resources are being used optimally or underutilized. The key elements of this report are:
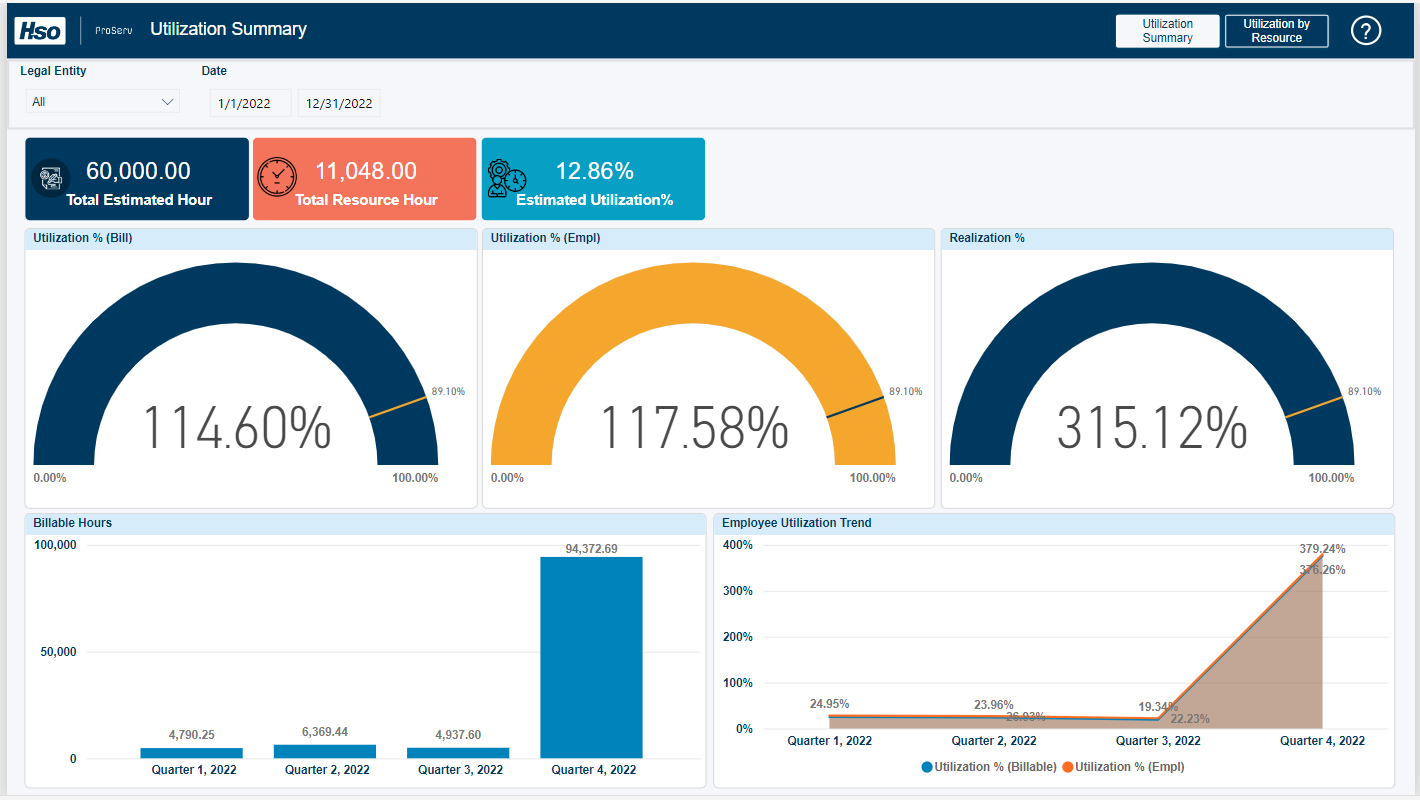
Utilization Summary: It provides insight on resource billable utilization percentage, utilization % for all employees, realization % in terms of utilization of resource, total billable hours (posted + unposted), and comparison between utilization % (billable) and utilization %(empl).
In the first tab, Utilization Summary, on the first row it shows overall billable utilization %, utilization % for all employees, and realization % in terms of utilization of resources. On the left side of the second row, it shows the historical trend of billable hours by hierarchal level quarters -> months -> weeks and on the right side, it shows the historical trend of comparison between billable utilization % and utilization % of employees by hierarchical level quarters -> months -> weeks.
In the second tab, Utilization by Resource, the user can see resource-wise billable hours, utilized non-billable hours, utilized internal hours, and total utilized hours against those resources with their utilization % for both billable and employee.
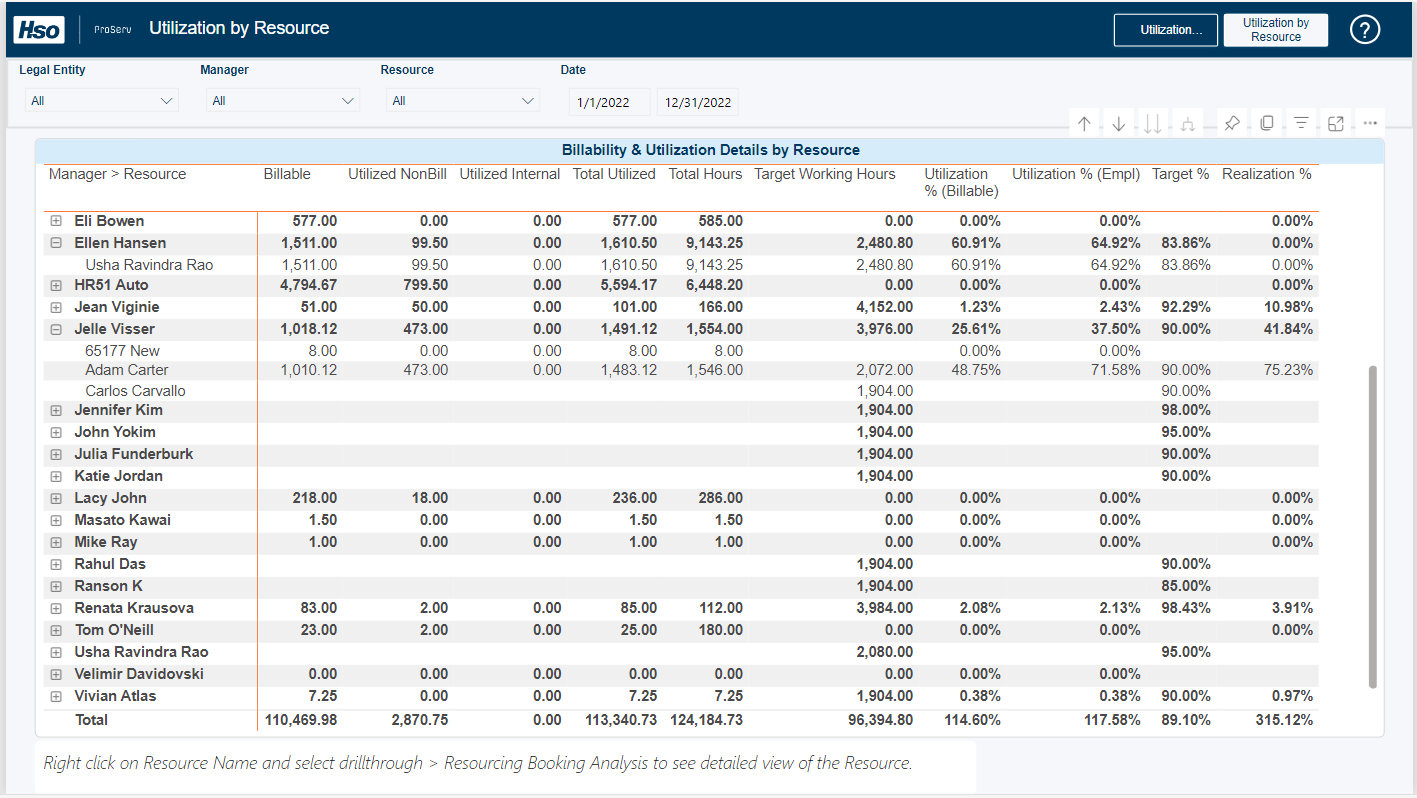
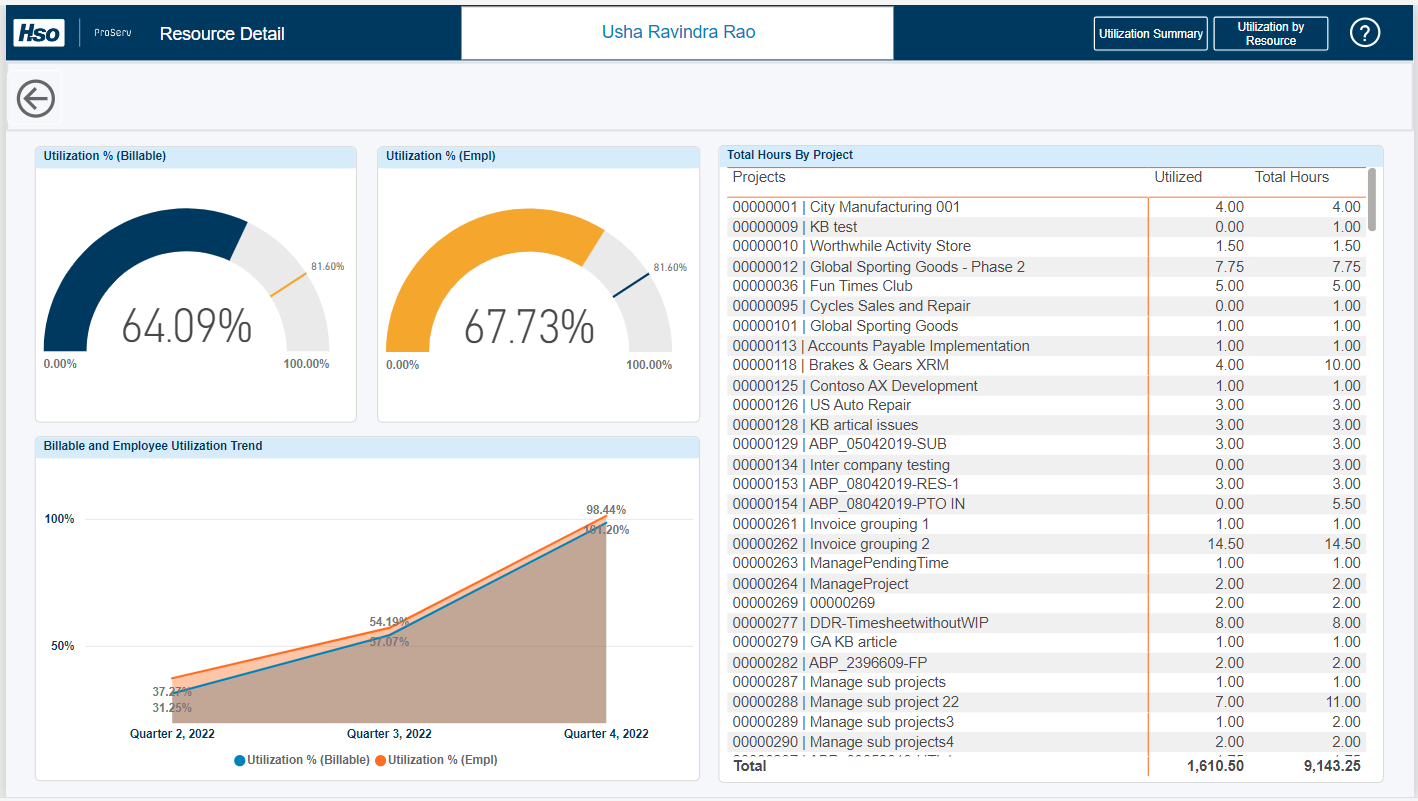
We have provided the drill through option to see more details for one selected resource. In drill-through, the user can see details like utilization% (billable) and utilization% (empl) for the selected period and project-wise details where he worked on and booked the hours. This will help the user make decisions for the future.
Post your comment on this topic.