
Introduction
This guide covers the end-to-end setup of Microsoft Fabric for an AEC360 deployment, written for initial configuration. Follow steps in sequence. The Architecture Overview provides essential context on the underlying data structure before implementation begins.
Fabric Medallion Architecture Overview
Microsoft Fabric is an end-to-end data and analytics platform that consolidates ingestion, transformation, storage, and business intelligence into a single governed environment. It enables organisations to manage the full data lifecycle within one cohesive architecture, from raw ingestion through to analytics and reporting.
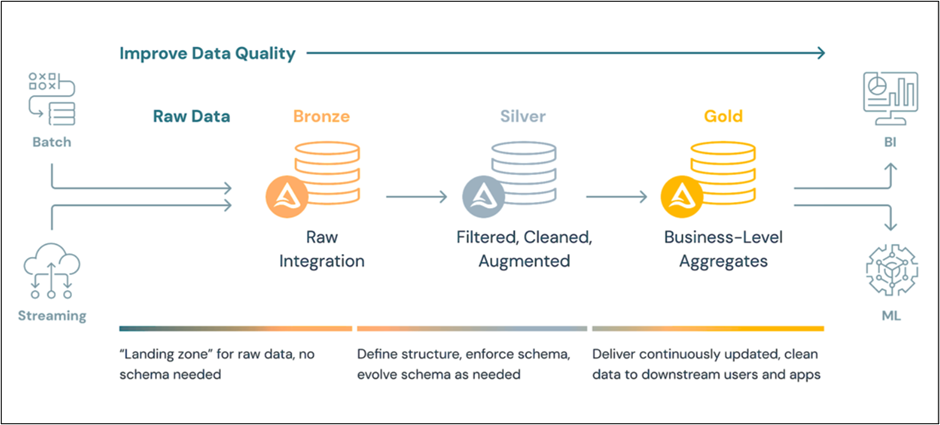
The medallion architecture is Fabric’s recommended pattern for structuring data. It organises data into three progressively refined zones, improving quality and business readiness at each stage. Each zone has a distinct purpose and a defined ownership boundary; upstream layers are never exposed directly to end users.
Bronze: Raw Data Landing Zone
The Bronze layer is the landing zone for raw data ingested from source systems. Data arrives in its original format, preserving source schema, system timestamps, and processing metadata. No transformations are applied at this stage, making Bronze an immutable record of everything received from the source.
Key characteristics:
- Schema mirrors the source exactly; no joins, filters, or business logic are applied.
- Data lands automatically via the ingestion mechanism; no custom pipeline code is required.
- Serves as the immutable source of truth; downstream layers read from Bronze rather than querying the source system directly.
Silver: Curated Reporting Layer
The Silver layer contains a selected, cleaned subset of Bronze data structured for reporting and analysis. Column selection, schema alignment, and light curation are applied. The data is validated and consistently shaped, but not yet aggregated or denormalised for end-user consumption.
Key characteristics:
- Curated selection of Bronze tables; only the data required for reporting scope is promoted.
- Accessible via SQL endpoint for self-service validation, profiling, and ad-hoc analysis.
- The foundation from which Gold reporting views are constructed; Silver is not exposed directly to end users.
Gold: Analytics-Ready Layer
The Gold layer is the consumption layer: the surface that semantic models and BI reports read directly. SQL views built on Gold tables apply the joins, transformations, and business logic required for reporting. These views produce stable, denormalised surfaces optimised for query performance and semantic model compatibility.
Key characteristics:
- SQL views apply business logic: joins, period alignment, hierarchies, and KPI derivations.
- Connected to the semantic model via the SQL endpoint; reports never access raw tables directly.
- The sole data source for all BI reports; Bronze and Silver layers are not exposed to end users.
Downstream Consumption
The Gold layer feeds two primary consumers:
- Business intelligence reports: Power BI reports and dashboards connect to the Gold semantic model for governed, scheduled reporting. This is the primary consumption surface for business users.
- Self-service analytics: Analysts and power users can connect directly to the Gold SQL endpoint for custom queries and ad-hoc reporting, without accessing raw Bronze or Silver data.
Medallion Layer Summary
| Layer | Location | Content | Consumers |
|---|---|---|---|
| Bronze | Dataverse Lakehouse (OneLake) | Raw Dataverse / F&O tables (unmodified) | Silver layer shortcuts |
| Silver | Silver Lakehouse (OneLake shortcuts) | Selected tables curated for reporting | Gold layer, ad-hoc queries |
| Gold | Gold Lakehouse (OneLake shortcuts) | Reporting-ready tables with SQL views | Semantic model, reports |
| Semantic Model | Fabric workspace | Governed measures, KPIs, relationships | Reports, end users |
Note: Microsoft Fabric Link for Dataverse is referred to as Fabric Link throughout this guide. In the Power Apps UI, the same feature appears under Azure Synapse Link for Dataverse > Link to Microsoft Fabric.
Prerequisites
Confirm the following are in place before starting. Proceeding without these items will result in errors during the Fabric Link setup wizard.
| Requirement | Detail |
|---|---|
| Fabric Capacity SKU | Active capacity provisioned in the correct Azure region; assigned to the target workspace |
| Power Apps Environment | Dataverse enabled; target tables (Dataverse and/or D365 F&O) accessible |
| User Permissions | Fabric Workspace Admin + Power Apps System Administrator role |
| BI Content Pack | Semantic models (Projects, AR, GL), reports, and supporting artifacts available for deployment |
Step 1: Create or Select a Target Fabric Workspace
The Fabric workspace is the container for all Fabric artifacts: Lakehouses, semantic models, and reports. It must be assigned to a Fabric capacity before any Fabric features are available.
1. Create a new Power BI/Fabric workspace or select an existing one.
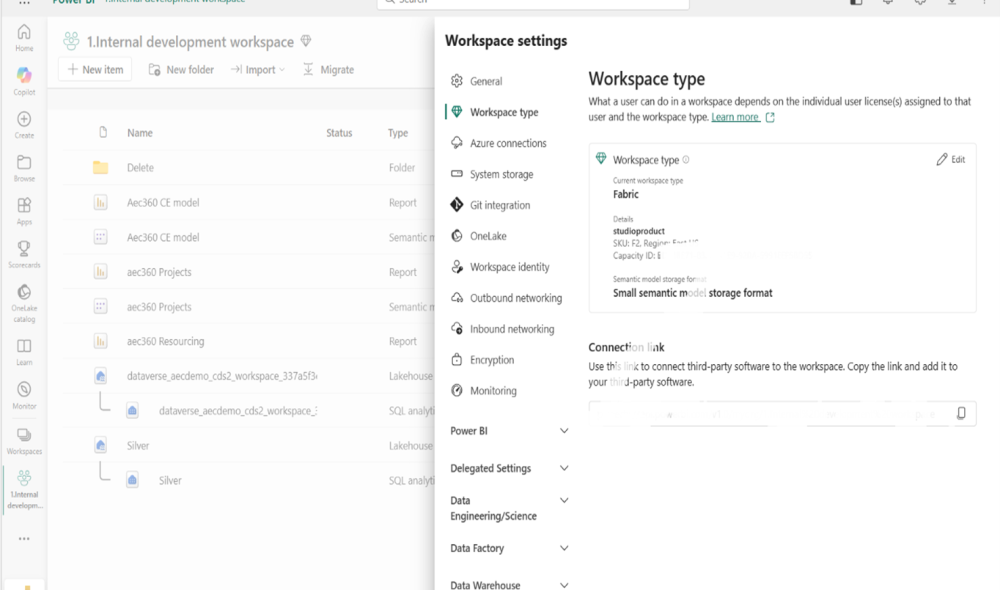
2. Open Workspace Settings and select Workspace type from the left menu.
3. Assign the Fabric capacity to the workspace.
4. Confirm the workspace type shows Fabric and that the capacity name, SKU, and region are correctly reflected.
Step 2: Create the Dataverse Fabric Link
A Fabric Link replicates selected Dataverse tables into OneLake-managed tables, making source data available in Fabric without custom ETL pipelines. The setup wizard in Power Apps provisions the Lakehouse, creates OneLake shortcuts, and initializes the first sync.
2.1 Navigate to the Link Wizard
5. Go to make.powerapps.com and sign in.
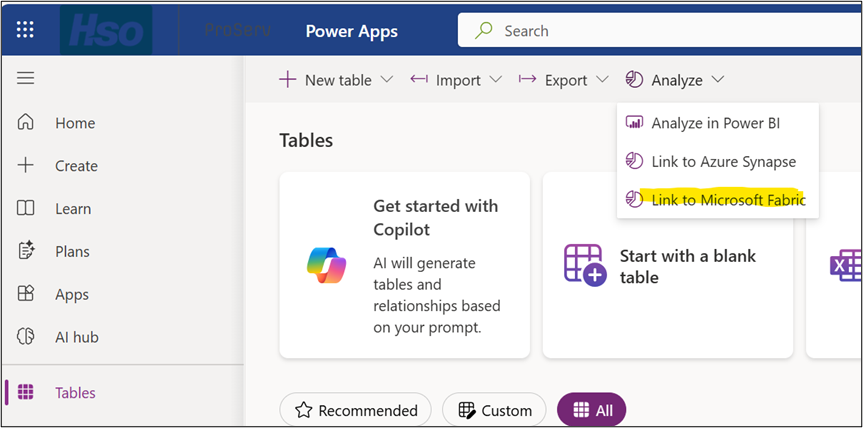
6. In the left navigation, select Tables.
7. On the command bar, select Analyze > Link to Microsoft Fabric.
2.2 Complete the Setup Wizard
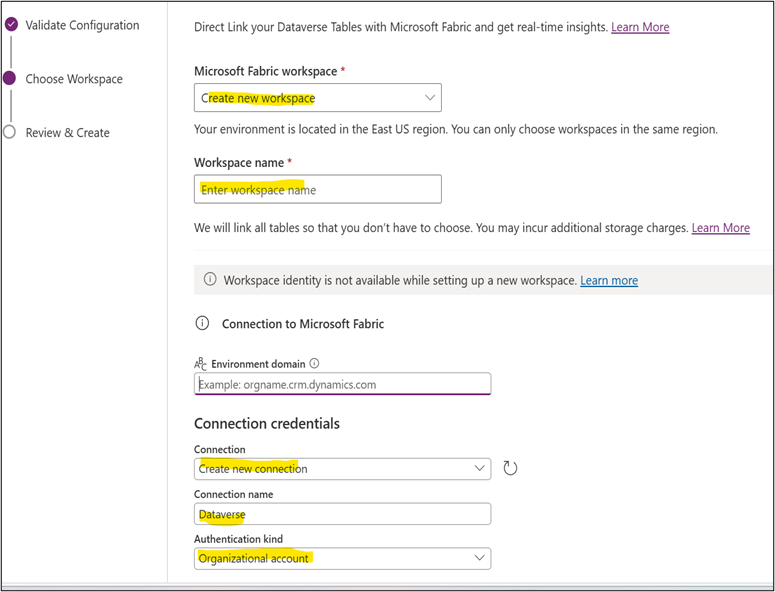
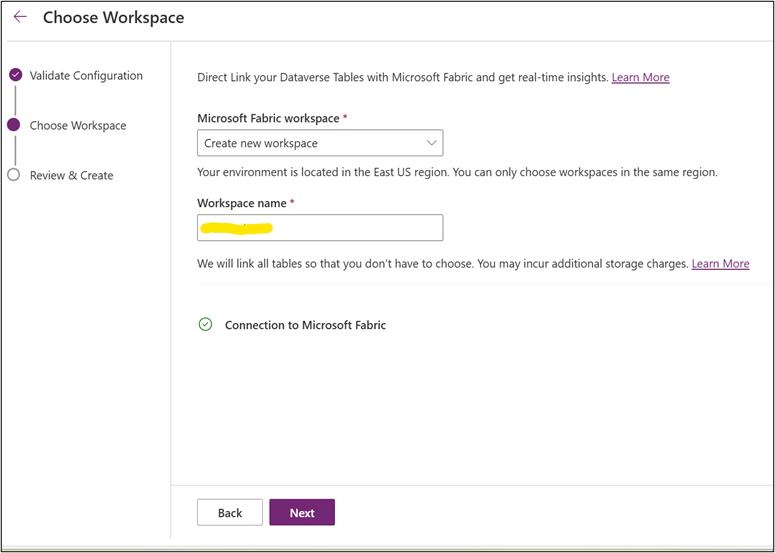
The wizard has three steps: Validate Configuration, Choose Workspace, and Review & Create.
Choose Workspace: Select an existing workspace or create a new one. Enter a workspace name. Under Connection credentials, click Create new connection and set Authentication kind to Organizational account. Provide credentials and save the connection.
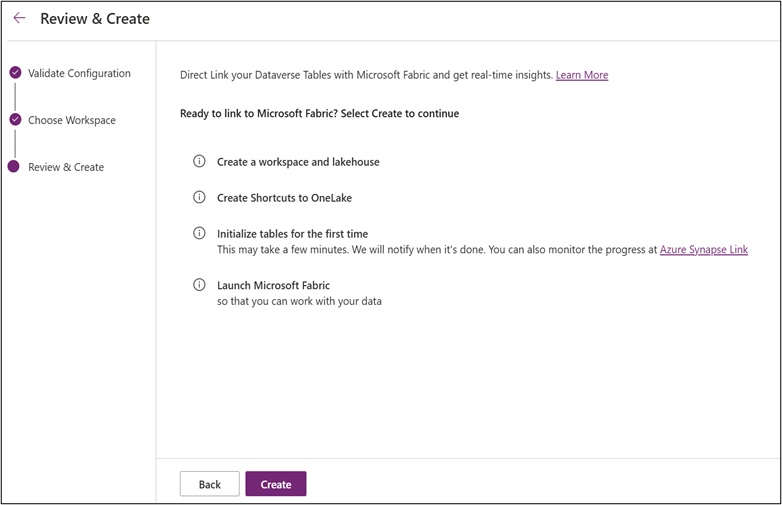
2.3 Review & Create
On the final wizard step, review the four provisioning actions and click Create:
- Create a workspace and lakehouse
- Create Shortcuts to OneLake
- Initialize tables for the first time (may take several minutes)
- Launch Microsoft Fabric
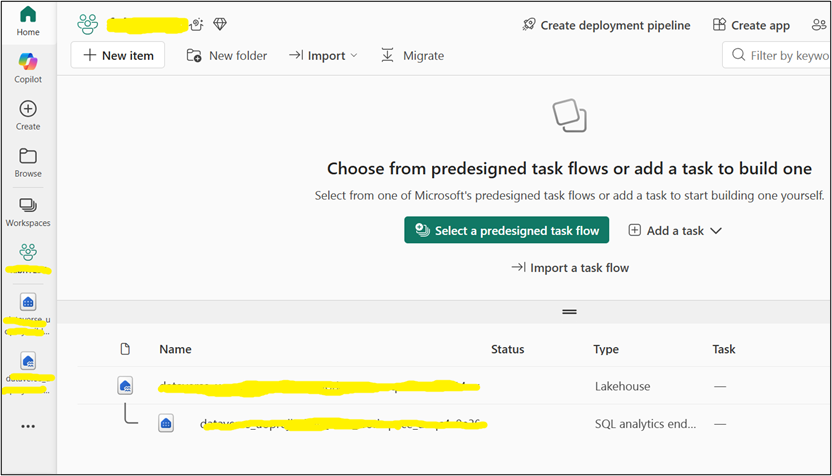
2.4 Confirm Successful Creation
After creation, Power Apps displays a confirmation banner. Fabric automatically provisions a Lakehouse and SQL analytics endpoint in the target workspace.
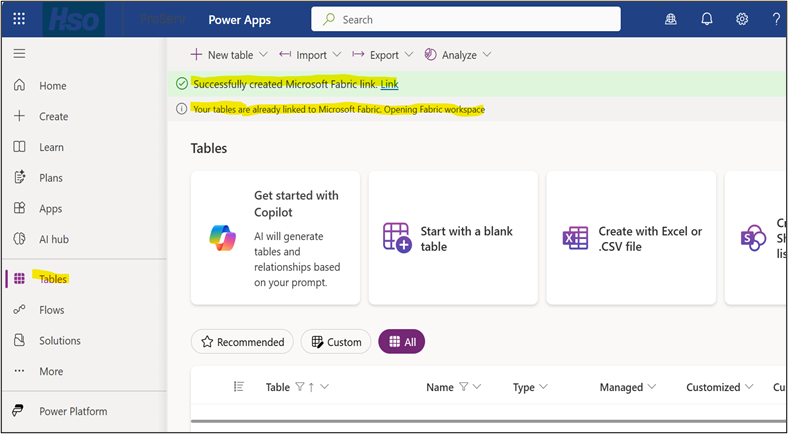
Click the link to navigate directly to the Fabric workspace to view both the Lakehouse and the SQL endpoint.
Step 3: Enable Tables via Manage Tables
The Fabric Link is not fully active until specific tables are selected for sync. This step is mandatory; without it, no data will land in the Bronze layer.
8. In Power Apps, select Azure Synapse Link from the left navigation pane.
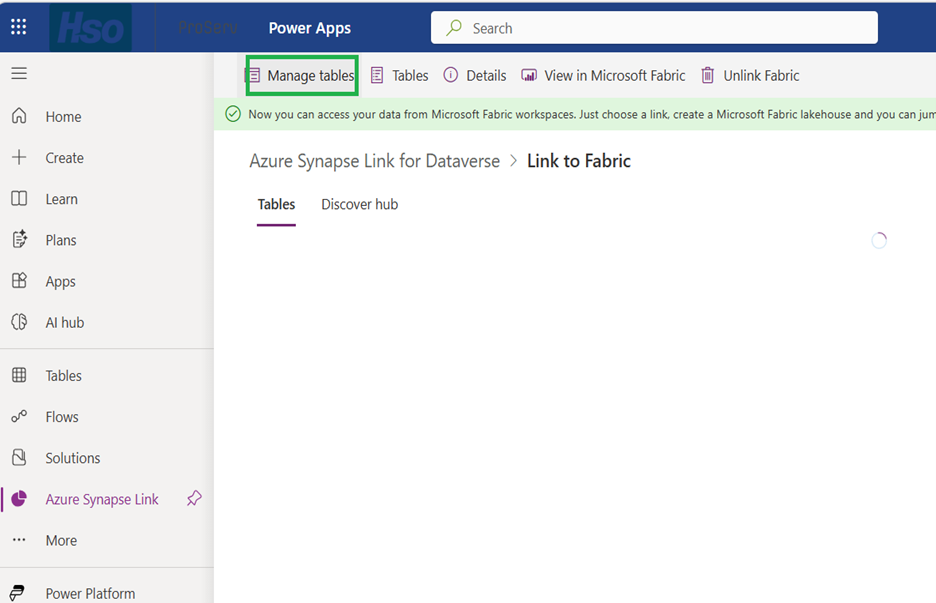
9. Select the Link to Fabric entry.
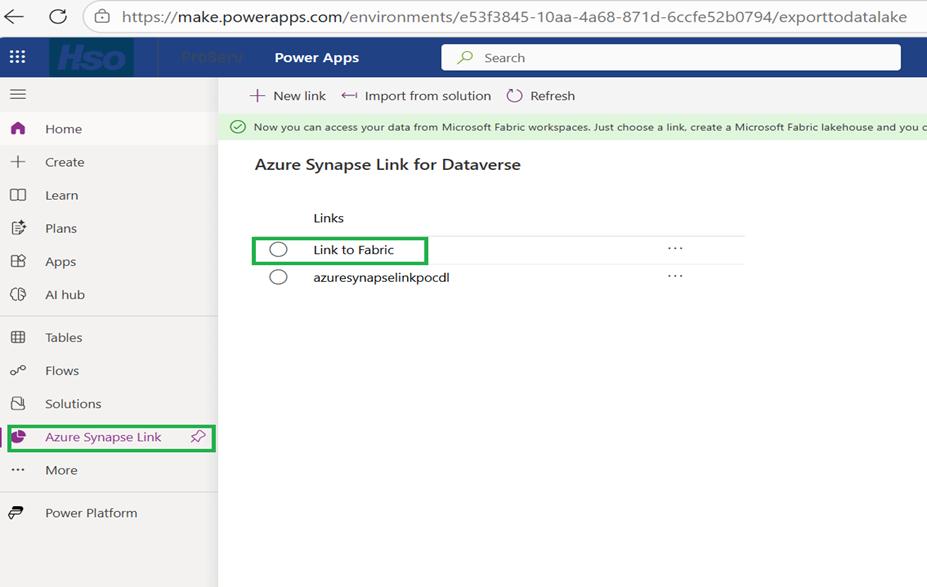
10. On the link detail page, click Manage tables.
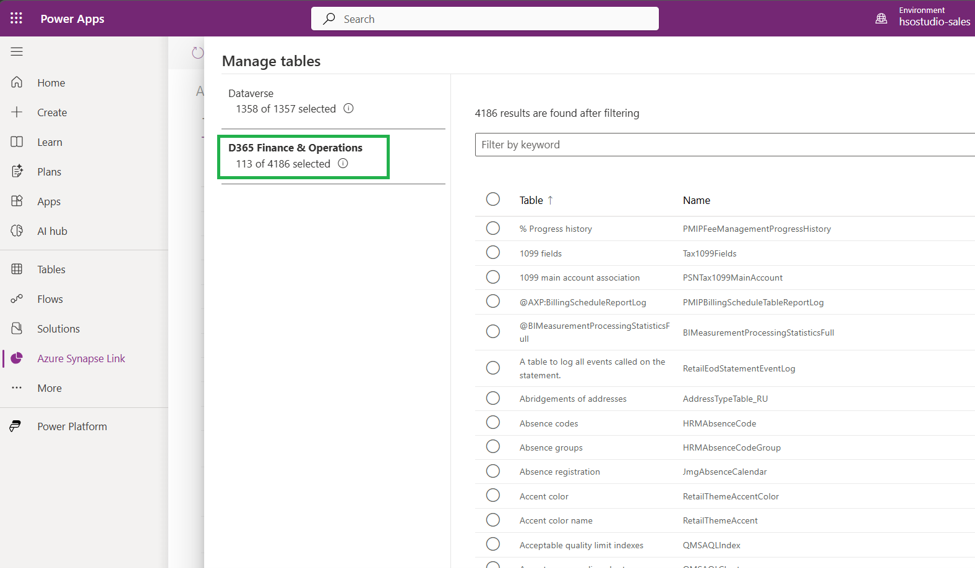
11. In the Manage tables panel, select the required tables:
- Select Dataverse tables required for the reporting scope.
- If D365 Finance & Operations (F&O) tables are in scope, they appear as a separate source group. Select the required F&O tables from that group.
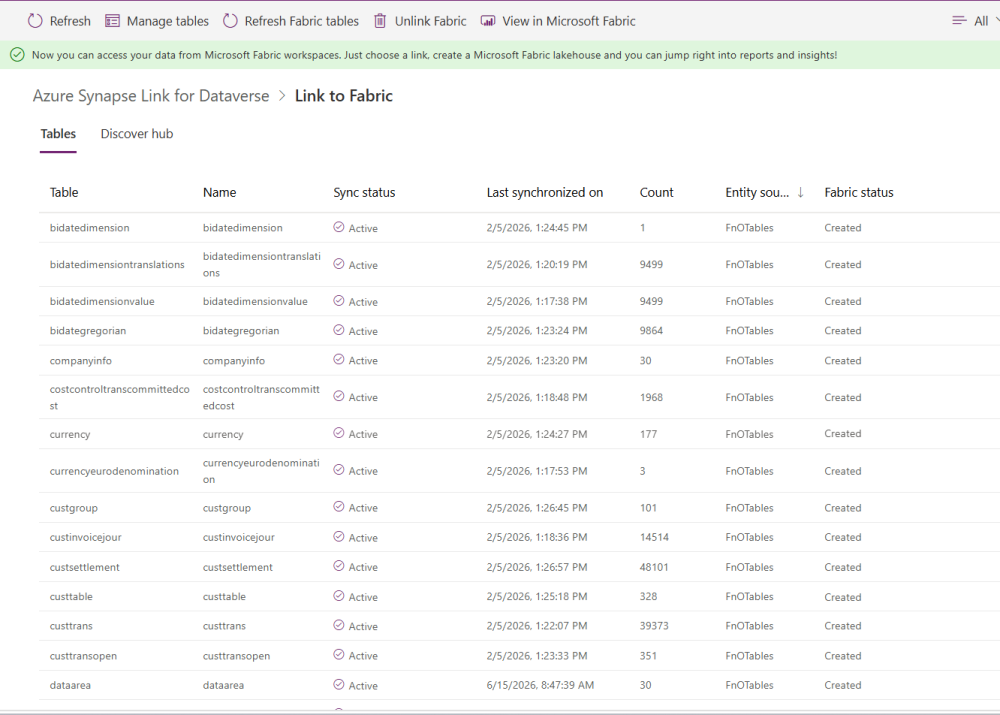
12 Click Save. Sync begins automatically. The link becomes fully active once Sync status shows Active.
13. In Power Apps, navigate to Azure Synapse Link > Link to Fabric. Confirm that all selected tables show Sync status = Active and a recent Last synchronized on timestamp.
Step 4: Validate the Bronze Layer
The Fabric Link creates a Lakehouse that holds the raw Dataverse tables. All of these tables are surfaced into the Bronze layer via OneLake shortcuts, which reference the data in place rather than copying it. This keeps the original Link to Fabric connection and landing data intact, making Bronze the unaltered raw foundation for all downstream layers.
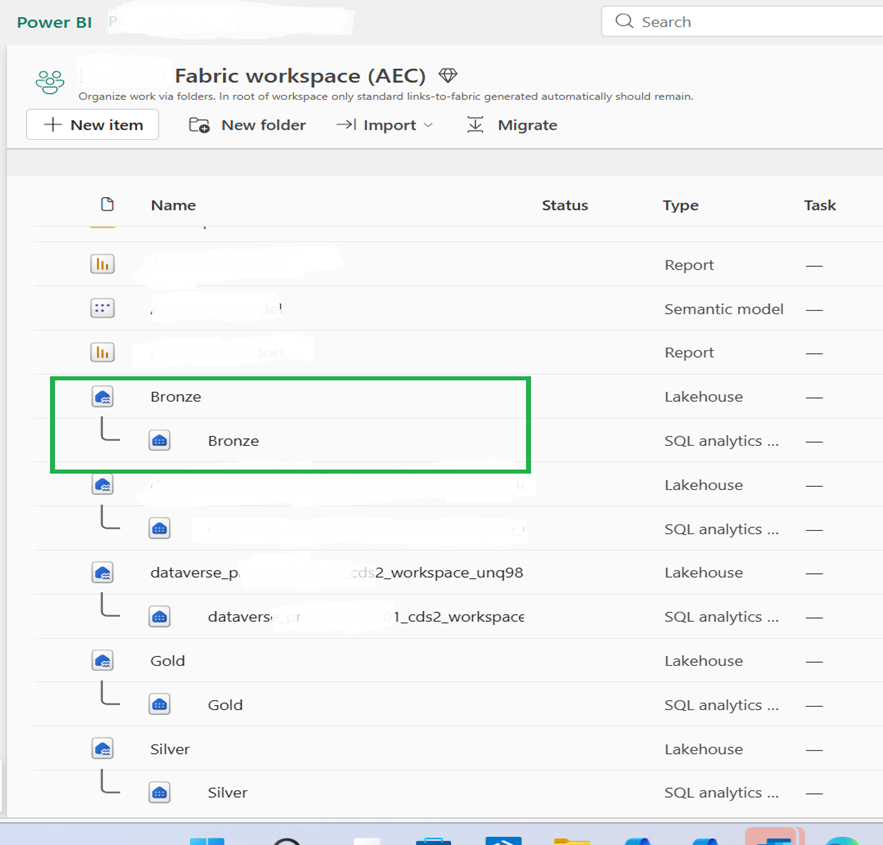
15. Open the Bronze Lakehouse and validate that the expected tables are visible and contain rows before proceeding.
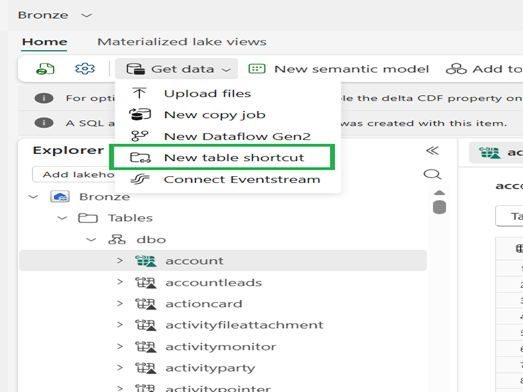
16. In the Fabric workspace, open the Bronze Lakehouse.
17. Select Get data > New table shortcut.
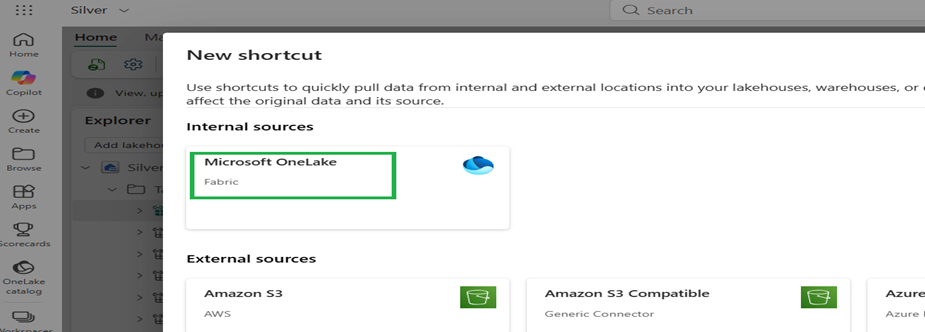
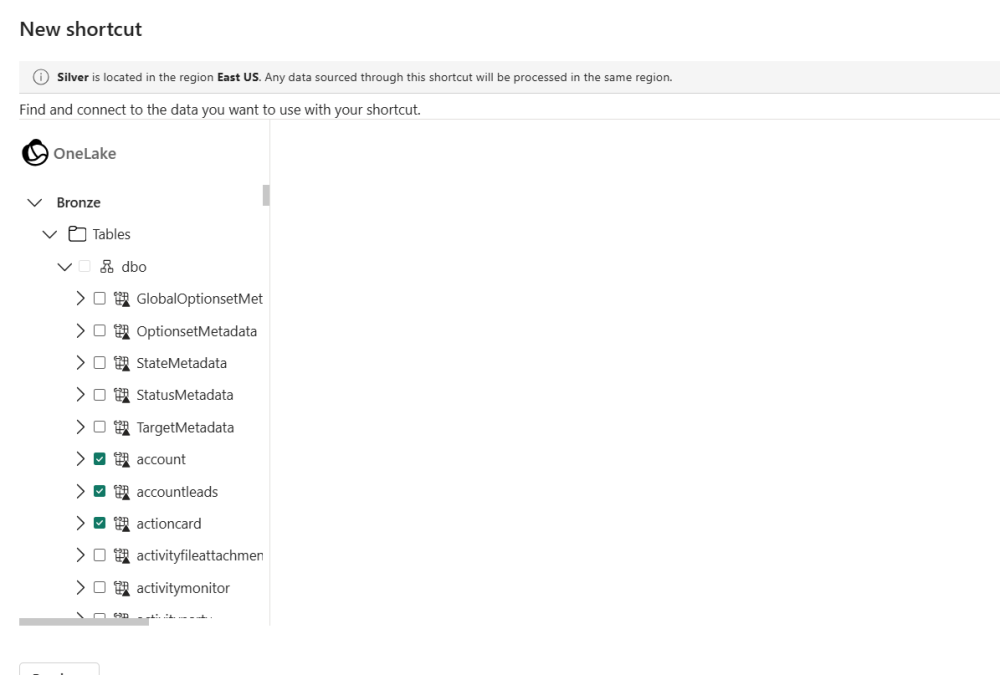
18. In the New shortcut dialog, select Microsoft OneLake as the source.
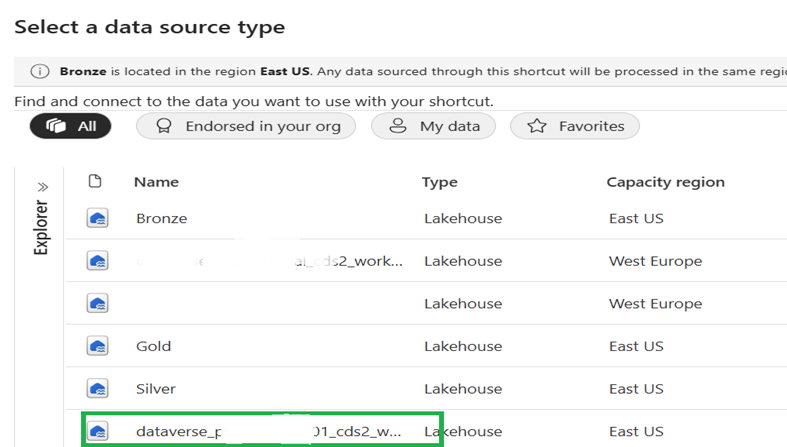
19. Browse to the Dataverse Lakehouse in the workspace. Confirm the source region matches the target region.
Step 5: Build the Silver Layer
The Silver Lakehouse contains a curated subset of Bronze tables selected for reporting. OneLake shortcuts are used to surface Bronze tables in Silver without copying data; changes in Bronze are immediately reflected in Silver.
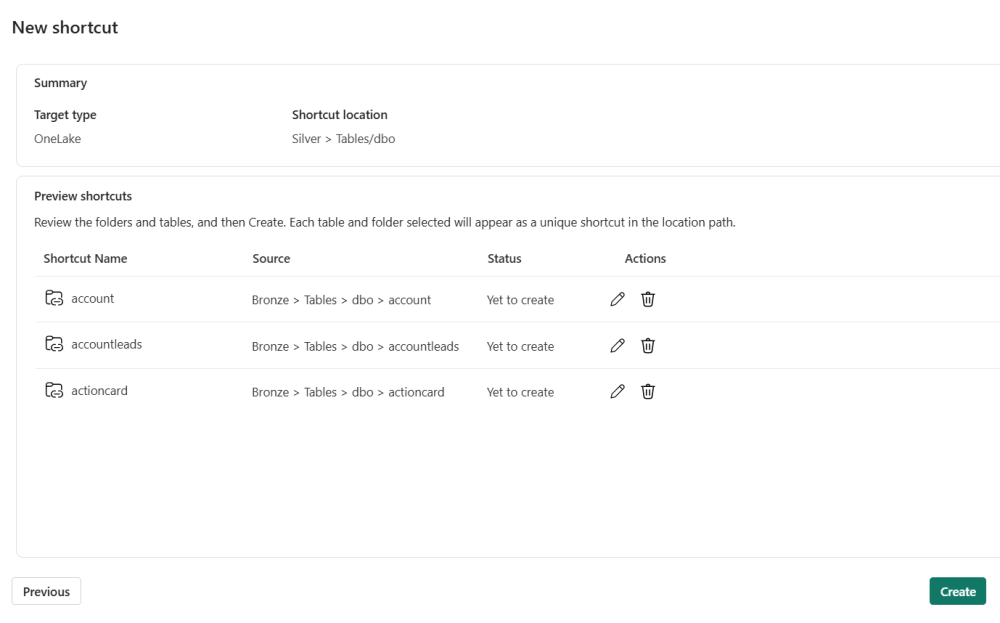
20. Select the tables required for reporting. Use the keyword filter to locate specific tables efficiently.
21. Review the shortcut summary and click Create.
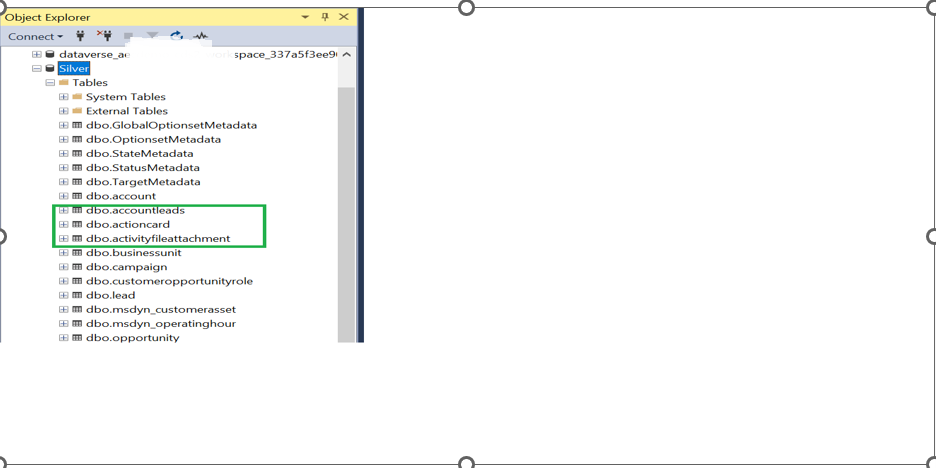
22. Verify in SSMS (or the Fabric SQL endpoint) that the selected tables appear under the Silver database.
Step 6: Build the Gold Layer
The Gold layer is the analytics-ready data store. The semantic model and reports connect to it (not directly to Silver or Bronze), keeping the reporting layer decoupled from raw ingestion.
23. Repeat the shortcut creation process from Step 5, this time working from the Silver Lakehouse as the source (not the Dataverse Lakehouse).
24. Select only the tables required for final reporting and semantic model consumption. Agree on this scope with the project team before proceeding.
25. Once shortcuts are created, connect to the Gold Lakehouse SQL endpoint using SSMS or the Fabric SQL editor. Note the connection string; it is required during semantic model setup in Step 8.
26. Validate that the selected tables are accessible via the SQL endpoint and contain the expected data.
Step 7: Create Reporting Views on the Gold Layer
SQL views on the Gold layer provide a business-friendly consumption interface for the semantic model, separating reporting logic from raw table structure. This layer is what the semantic model reads; it should be stable and well-named.
27. Connect to the Gold Lakehouse SQL endpoint using SSMS or the Fabric SQL editor.
28. Create SQL views that:
- Apply the joins required for reporting (e.g., project to GL accounts, project to AR transactions).
- Use business-friendly column names aligned with field naming conventions.
- Include any derived columns, filters, or calculated fields required by the semantic model.
- Expose only the columns needed: avoid
SELECT *in views.
29. Validate each view: confirm it returns the expected row count and column structure before proceeding.
Best practice: Name views using a consistent prefix (e.g., vw_Projects, vw_ARTransactions) to distinguish them from base shortcut tables in the Gold layer. This simplifies semantic model maintenance.
Step 8: Build the Semantic Model
The semantic model is the governed reporting layer; all reports connect to it rather than directly to underlying tables. Centralising business logic here ensures consistency across reports and simplifies future updates.
30. In the Fabric workspace, create a new semantic model and connect it to the Gold layer reporting views using the SQL endpoint connection string from Step 6.
31. Define relationships between tables, ensuring cardinality and cross-filter direction are correctly set.
32. Create measures and KPIs aligned with the reporting requirements, including:
- Project profitability and cost tracking
- AR aging and outstanding balances
- GL period balances and budget comparisons
33. Apply Row-Level Security (RLS) rules if required by the client’s security model.
34. Validate all measures against known reference data before deploying reports on top.
Step 9: Deploy the BI Content Pack
The BI Content Pack provides the standard report templates and semantic model definitions for the solution. Deployment into the target workspace makes these reports available to end users.
35. Import the BI Content Pack artifacts into the capacity-assigned Fabric workspace:
- Semantic models: Projects, AR, GL
- Reports
- Any additional supporting items included in the package
36. Reconnect each report to the deployed semantic model in the target workspace.
37. Set data source credentials for each semantic model and validate all connections.
38. Trigger and confirm a successful refresh for each semantic model before proceeding to validation.
Step 10: Final Validation and Handover
Before handing over the solution, conduct a structured validation with business users and document the operational model. This step is required for a successful transition to operational support.
Validation
39. Walk through all deployed reports with business users and confirm:
- Reports, KPIs, and filters return expected results across representative data scenarios.
- Refresh schedules are configured and have completed at least one successful run.
- User access is correctly provisioned (workspace roles, object permissions, RLS where applicable).
Handover Documentation
Provide the client with a brief handover document covering:
- Workspace ownership and administrator contacts
- Refresh schedule and SLA expectations
- Known data scope limitations or exclusions from reporting
- Escalation path for issues after go-live
Important: Confirm that the client has at least one designated workspace admin before handover. Without this, they cannot manage workspace access or troubleshoot refresh failures independently.
Microsoft Fabric Link for Dataverse: Feature Overview
Microsoft Fabric Link for Dataverse enables near-real-time replication of selected Dataverse tables into OneLake-managed tables, making data available in Fabric without custom ETL pipelines. It preserves source alignment in the Bronze layer and supports downstream curation in Silver and Gold for reporting and analytics.
The feature is accessed through Azure Synapse Link for Dataverse in Power Apps and requires Fabric capacity. Once enabled, selected tables sync automatically; no pipeline code or scheduled extract jobs are needed.
Business Benefits
- Faster time to insight: reduces data engineering setup effort from weeks to hours
- Standardised reporting architecture with governed semantic models, reducing report sprawl
- Scalability for enterprise BI use cases across multiple reporting domains without additional integration work
Technical Benefits
- Managed ingestion from Dataverse to OneLake: no custom copy pipeline required
- Zero-copy shortcuts in Silver and Gold reduce storage overhead while preserving Bronze integrity
- Reusable medallion architecture supports multiple reporting domains from a single ingestion layer
- SQL endpoint accessibility enables ad-hoc validation, view design, and direct model consumption
Cost Considerations
Fabric Link is included in existing Fabric capacity; no additional connector or per-GB ingestion charge applies. The cost comparison below outlines why this approach is preferable to reading directly from Dataverse or using custom ETL pipelines.
| Approach | Cost Impact |
|---|---|
| Direct Dataverse reporting queries | Consumes metered API calls; subject to service protection limits at scale; heavy queries degrade CRM performance for business users |
| Custom ETL pipelines | Requires separate tooling licenses, ongoing engineering effort, and pipeline maintenance; higher delivery timeline and total cost of ownership |
| Fabric Link (recommended) | Included with Fabric Capacity; replicates data once into OneLake; all reporting queries run from Fabric, eliminating API consumption; OneLake storage cost is minimal (low per-GB rate) |
Architecture Suitability
Best Suited For
- New analytics and reporting deployments on Fabric capacity
- Environments already enabled for Fabric capacity
- Teams adopting a Fabric-native data platform strategy
Not Recommended For
- Environments without Fabric capacity: evaluate Power BI Premium or alternative integration approaches
- Use cases requiring real-time (sub-second) data: Fabric Link provides near-real-time latency, not streaming
Operational and Governance Considerations
Before handover, align with the client on the following items to ensure the solution is operationally sustainable:
- Capacity sizing: Validate that the Fabric SKU is sized appropriately for the expected data volume and number of concurrent report users.
- Sync latency: Set clear expectations on sync frequency and acceptable data latency for business users (Fabric Link is near-real-time, not instantaneous).
- Security model: Confirm workspace roles, object-level permissions, and RLS/OLS configuration are aligned with the client’s access control requirements.
- Monitoring and support: Define who owns monitoring of refresh failures and sync issues after handover.
- Data residency: Confirm that the Fabric capacity region is aligned with the Dataverse environment region and any data residency requirements.
Fabric Positioning Guidance
Clients running reports directly against Dataverse, or using custom ETL pipelines for analytics, are likely incurring unnecessary cost through API consumption, separate tooling licenses, or ongoing engineering effort. Fabric Link addresses this by replicating data once into OneLake, so all reporting workloads run from Fabric, protecting CRM performance, eliminating API throttling risk, and removing the need for custom integration pipelines.
For clients already invested in Fabric capacity, Fabric Link is included at no additional cost, making it a low-risk, high-value recommendation. Initial setup can be completed in hours rather than weeks, with no pipeline code or custom connector licensing required.
The resulting architecture is reusable and scalable: a governed data foundation that supports multiple reporting domains and future analytics growth as the client’s requirements evolve.
Fabric Link is not just as a technical feature, but a cost-reduction and risk-reduction conversation: fewer moving parts, lower license overhead, and a platform the client may already own.
Post your comment on this topic.